Matplotlibでグラフを作る方法を何度か紹介してきましたが、今回は、それをSphinx文書中に埋め込む方法をちょろっと書きます。
WindowsのPython 3.3+Matplotlib 1.4.0 という少々微妙な構成でやっています。
この構成だと、リファレンス通りにやってもエラーが出て動きません。
結論から言うと、
pip install ipython
でIPythonをインストールして
sys.path.append(os.path.abspath('sphinxext'))
extensions += [
          'matplotlib.sphinxext.mathmpl',
          'matplotlib.sphinxext.only_directives',
          'matplotlib.sphinxext.plot_directive',
          'IPython.sphinxext.ipython_directive',
          'IPython.sphinxext.ipython_console_highlighting']
のようにconf.pyに追記すればいいのです。
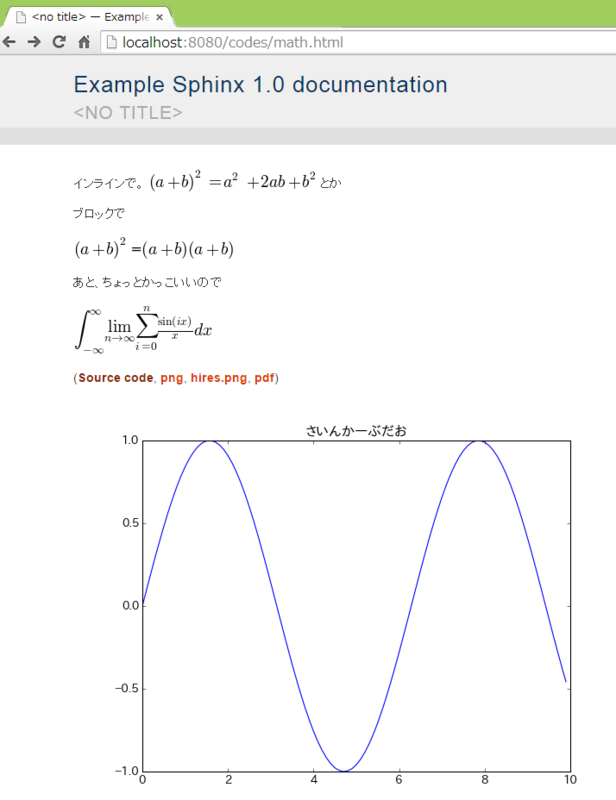
こうすれば、インラインで。 :math:`(a + b)^2 = a^2 + 2ab + b^2` とか
ブロックで
.. math::
(a + b)^2 $=$ (a + b)(a + b)
あと、ちょっとかっこいいので
.. math::
\int_{-\infty}^{\infty} \lim_{n\to\infty}\sum_{i=0}^{n} \frac{\sin(ix)}{x} dx
.. plot::
from pylab import *
x=arange(0,10,0.1)
y=sin(x)
title(u"さいんかーぶだお")
plot(x,y,"-")
show()
みたいなことを書いて文書をビルドして、トップ画像のようなページができます。
「お、思ったより書く量が少ないぞ?!」って思いません?
ちょっと文法に癖はありますが、覚えてしまうと図もプログラムコードをそのまま埋め込んで書けますし、なによりWindowsじゃなくてLinuxでもMacでも動くのでMS Officeの心配しなくてもよいのです。
jsmathとかを使ったほうが .. math:: の処理はいろいろできるっぽいんですが、
- ・いかんせん動作が重い
- ・httpサーバを立ててファイルをおかないと(ローカルHTMLファイルを開くだけでは)数式が表示できない
という理由(とくに2点目が致命的)で却下・・・。
あ、最後に、どんなエラーに悩まされるか、少しだけ書いておきます。
リファレンスによると、conf.pyには
sys.path.append(os.path.abspath('sphinxext'))
extensions += [
          'matplotlib.sphinxext.mathmpl',
          'matplotlib.sphinxext.only_directives',
          'matplotlib.sphinxext.plot_directive',
          'matplotlib.sphinxext.ipython_directive',
          'sphinx.ext.autodoc',
          'sphinx.ext.doctest',
          'ipython_console_highlighting',
          'inheritance_diagram',
          'numpydoc']
と追記してやれば動くように書いてますが、時代は進んでそうはいかず、
ビルド時にIPythonを使えと言われます。
C:\Users\yi01\Desktop\sphinx\example>make html
Running Sphinx v1.2.3
C:\Python33\lib\site-packages\matplotlib\cbook.py:133: MatplotlibDeprecationWarning:
The Sphinx extension ipython_console_highlighting has moved from
matplotlib to IPython, and its use in matplotlib is deprecated.
Change your import from 'matplotlib.sphinxext.ipython_directive' to
'IPython.sphinxext.ipython_directive.
  warnings.warn(message, mplDeprecation, stacklevel=1)

Extension error:
Could not import extension matplotlib.sphinxext.ipython_directive (exception: Unable to import the necessary objects from IPython. You may need to install or upgrade your IPython installation.)
んで、ipythonを入れて、なんとなくextensionsの中身をmatpltlibからipythonに変えても、いろいろまだいわれます。
継承図をかくためにinheritance_diagramをインポートしないといけないんですが、それがインストールされていない、とかそういう系の。
継承図はわざわざMatplotLibを使って書かないと思うので、外して、最初の方に書いた結論に至りました。
おわり。